This video presents “Toronto: Come Grow With Us.”
- “Discover the city of Toronto, Ontario, Canada and learn why Toronto is the best city for your business to grow and prosper.
- As the economic engine of Canada and one of the most multicultural cities in the world, Toronto offers an exceptional quality of life in addition to a competitive business environment.
- Toronto is a city of opportunity. Come grow with us!“
“How Does the City Grow?”: Toronto’s Third Annual Development Project Review Bulletin Released
On October 22, 2013, at the Planning and Growth Management Committee meeting, the City Planning Division presented “How Does the City Grow?,” an annual publication now in its third year, which
- provides an overview of development projects received by the City Planning Division between January 1, 2008 and December 31, 2012, and
- illustrates how Toronto has grown since the Official Plan came into force in June 2006 and how it will continue to develop over time.
Toronto’s Official Plan (June 2006) is the road map for how the City will develop over the next 20 years.
- Its central geographic theme is to direct growth to appropriate areas and away from the City’s stable residential neighbourhoods and green spaces.
- New development will be targeted to only about 25% of the City’s lands, while the remaining 75% will be protected from significant intensification.
- The locations recognized as being most appropriate for growth are those identified in the Official Plan’s Urban Structure Map (pdf) as Avenues, Centres, the Downtown & Central Waterfront, and Employment Districts, as well as other areas in the City designated as Mixed Use and Employment Areas.
- Between 2008 and 2012, the City of Toronto received proposals for over 148,000 residential units and 4.25 million square metres of non-residential space, about 40 per cent of which is in the downtown.
- The majority of development proposed in the city is occurring in areas the Official Plan has targeted for growth.
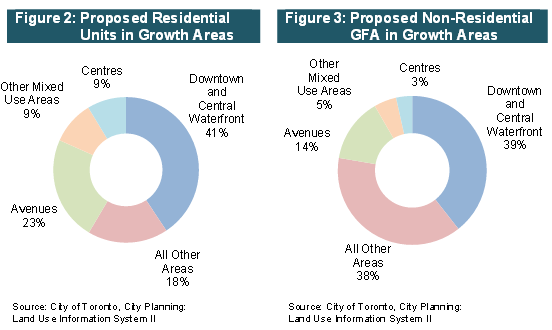
- As seen in Figure 2 below, since the Official Plan came into force, 82% of the residential units are proposed to be built in the Downtown, in the Centres, along the Avenues, and in other Mixed Use Areas throughout the City.
- Almost two-thirds (62%) of the non-residential space (a.k.a. Gross Floor Area or GFA) was also proposed in these same areas (Figure 3 below), while the remaining 38% of the non-residential GFA was proposed in the Employment Districts or other Employment Areas.
- The Official Plan’s employment districts will help the city reach its forecasted growth potential by the year 2041; the employment districts have 1.1 million square metres of the non-residential space proposed.
- The majority of development proposed in the city is occurring in areas the Official Plan has targeted for growth.
Downtown
- The Downtown and Central Waterfront area is the most prominent location of development activity in the City and contains the largest percentage of proposed residential development in all the City’s growth areas.
- Between January 2008 and December 2012, 60,300 units and 1.67 million m2 of non-residential GFA were proposed in the area.
- This comprises 41% of the residential units and 39% of the non-residential GFA proposed in the entire city.
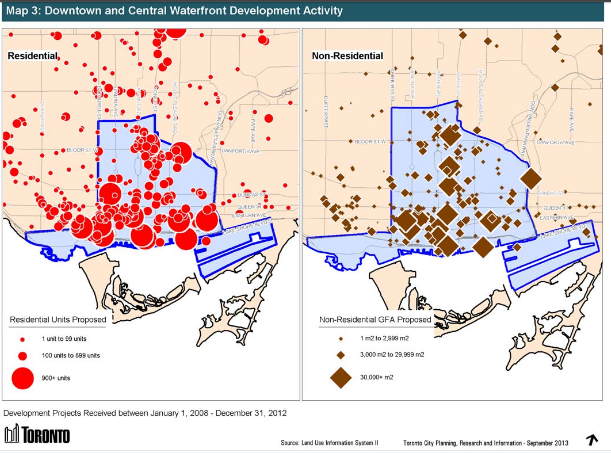
- Map 3 (above) shows the distribution of residential (red) and non-residential (brown) projects throughout the Downtown.
- A large portion of the residential development is proposed south of Queen Street, with another large cluster of units along Bloor Street east of Avenue Road.
- The non- residential developments are more dispersed throughout the area with large projects occurring along Yonge Street, from Bloor Street West to Front Street, and another cluster in the area of Spadina Avenue south of Queen Street West.
Centres
- The four Centres are focal points of transit and infrastructure that are vital to the City’s growth management strategy.
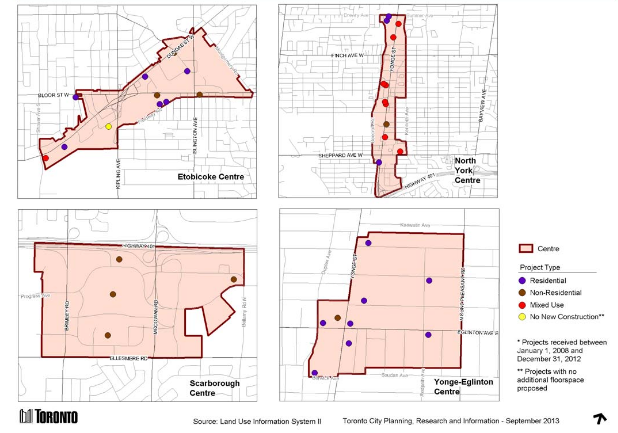
- The distribution of the 36 projects proposed in the Etobicoke, North York, Scarborough and Yonge-Eglinton Centres can be seen in Map 4 above.
- These projects contain almost 9% of the City’s proposed residential units.
- About 12,900 units as well as 148,700 m2 of non-residential GFA are proposed in the Centres.
- The residential projects in the Centres are generally high-density development with an average of 500 residential units per project.
- This is the highest average in the growth areas, higher than the Downtown which has an average of 390 units per residential project.
- North York Centre has the most residential activity proposed in the Centres with 38% of the residential units, while the Yonge/- Eglinton Centre has the most non- residential development activity among the Centres with 37% of all proposed non-residential GFA.
Avenues
- The Avenues are corridors along major streets well served by transit which are expected to re-develop incrementally over time.
- They have been an effective alternative to the Downtown and the Centres for redevelopment and have 34,300 units and 591,400 m2 of non-residential GFA proposed since January 2008.
- This is about 23% of the City’s proposed units and 14% of its proposed non-residential GFA.
Other Mixed Use Areas
- Outside of the Downtown, Centres, and Avenues, there are numerous other locations throughout the City that are designated as Mixed Use Areas, which encourage a broad range of commercial, residential and institutional uses, such as local shopping areas along minor arterial roads.
- These additional Mixed Use Areas have another 14,300 units and 207,900 m2 of non-residential GFA proposed.
- This accounts for 10% and 5% of the City’s proposed residential units and non-residential GFA respectively.
All Other Areas
- Almost 26,500 units or 18% of the units proposed in the City are outside of the growth areas – the Downtown, Centres, Avenues and other Mixed Use Areas.
- These projects are generally smaller replacement or infill projects, in areas designated as Neighbourhoods.
- There is 1.63 million m2 of non-residential GFA also proposed in these other areas, most of which is in the Employment Districts or other Employment Areas which the Official Plan targets for non-residential growth.
Employment Districts
- There is a long-standing trend towards core cities in North America metropolitan areas losing manufacturing activities to suburban locations over an extended period of time.8
- Toronto is no different than these other cities.
- Employment in the manufacturing sector in Toronto has been decreasing almost every year since 1983, from 25% to 10% of total employment in 2012.
- However, at the same time, Toronto’s employment activity has grown and diversified.
- Each of the 22 Employment Districts has a unique employment character and many are undergoing a gradual shift in focus from traditional manufacturing to a more diverse employment structure.
- In 2012, the manufacturing sector accounted for about 30% of all the jobs in the Employment Districts.9
- These Employment Districts are also attractive locations for the creation of new, small businesses.10
- With 1.66 million jobs forecasted for the City of Toronto by 2031,11 the protection and enhancement of the Employment Districts is vital to the City’s economic health.
- The developments proposed in the Employment Districts will help the City reach its forecasted growth potential.
- The Employment Districts have 1.1 million m2 or 25% of the City’s proposed non-residential GFA.
- While overall employment in these Districts has declined over the past 5 years, new development could bring new life and new jobs to many of these areas.
- Building permits have already been issued for about 30% of the proposed GFA in Employment Districts, which amounts to 313,200 m2 of new non- residential floor space in 91 different projects.
- Over the next few years, as building permits are issued for the projects that have been approved, another 301,500 m2 of non-residential GFA in 44 projects will be constructed in the Employment Districts.
- Of the 22 Employment Districts, 40% of the proposed non-residential GFA is concentrated in three Districts: Duncan Mills, South Etobicoke, and Tapscott/Marshalling Yard.
- Over 429,600 m2 of non-residential GFA is proposed in these three Districts, which accounts for 10% of all non- residential space proposed in the entire City over the last five years.
- While most of the lands in the Employment Districts are designated as Employment Areas in the Official Plan, there are a number of areas outside of the Districts that are also designated as Employment Areas.
- According to the Official Plan, “Employment Areas are places of business and economic activity.
- Uses that support this function consists of: offices, manufacturing, warehousing, distribution, research and development facilities, utilities, media facilities, parks, hotels, retail outlets that are ancillary to the preceding uses”.12
- Employment Areas exist in Centres, Employment Districts and along the Avenues.
- The large majority of Employment Areas are located inside Employment Districts.
- Not all lands within Employment Districts are designated Employment Areas, some are Mixed Use and other uses.
Toronto Office Market
- Downtown Toronto is the largest employment centre in the regional economy and Canada’s premier business office centre.
- Office tenants are continuing to find Downtown Toronto as a preferable office location and are prepared to pay a premium to be there.
- Given this continued strong demand, developers are building again.
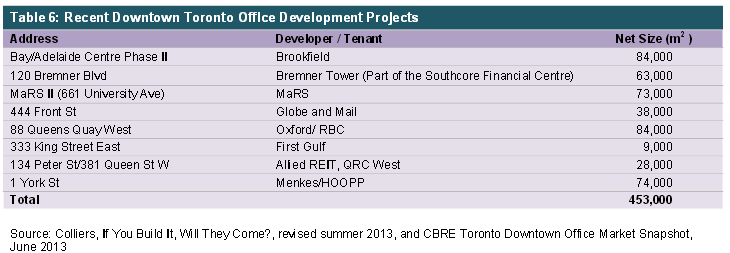
- Currently, there are eight buildings under construction, which will add over 453,000 m2 in the next 2 to 3 years (Table 6 above).
- This is a high level of development whereby in the second quarter of 2013, Downtown Toronto accounted for about 92% of the office space under construction in the GTA.
- Downtown Toronto accounts for about one-quarter of all the office space currently under construction in Canada.18.
- It is estimated that a further 15 office buildings are actively being planned in the Downtown (Figure 6 below).
- These projects are scheduled to come to market between 2016 and 2018.
- It is estimated that a further 15 office buildings are actively being planned in the Downtown (Figure 6 below).
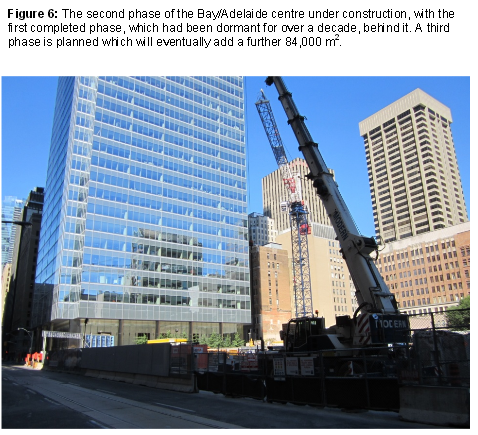
It should be noted that there are other major non-office developments occurring throughout the City.
- This includes the following developments.
- Ripley’s Aquarium which recently opened.
- Delta Hotel in the Southcore Financial Centre.
- Yorkdale Shopping Centre expansion.
- Union Station revitalization.
- The Athletes’ Village and other facilities for the Pan/Parapan American Games 2015.
Endnotes (from “How Does the City Grow?” – September 2013 bulletin)
8 Kneebone, Elizabeth (2013) Job Sprawl Stalls: The Great Recession and Metropolitan Employment Location, Brookings Institution.
9 City of Toronto, City Planning, Toronto Employment Survey, 2012.
10 City of Toronto, City Planning, Employment Districts Profile, July 2010.
11 The Official Plan was adopted before the Growth Plan came into force. By provincial legislation, the Official Plan must be brought into conformity with the policies of the Growth Plan. Toronto’s Official Plan contemplates the city having 3 million people and 1.85 million jobs by 2031. The 2006 Growth Plan forecasts 3.08 million people and 1.64 million jobs in the City of Toronto by 2031.The amended Growth Plan, including revised forecasts, came into effect in June 2013.
18 CBRE, Canada Office Marketview, Q2, 2013.
Please direct information inquiries and publication orders to:
City Planning Division
Strategic Initiatives, Policy & Analysis
Metro Hall, 22nd Floor
Toronto, Ontario M5V 3C6
tel: 416-392-8343
fax: 416-392-3821
TTY: 416-392-8764
e-mail: cityplanning@toronto.ca
This latest edition of How Does the City Grow?, along with previous issues, can be found on the City of Toronto’s website at http://www.toronto.ca/planning/grow.htm .
Toronto, Ontario, Canada
NEWS RELEASE
October 23, 2013
How Does the City Grow: third annual development project review bulletin released
At yesterday’s Planning and Growth Management Committee meeting, the City Planning Division presented “How Does the City Grow,” an annual publication now in its third year, which provides an overview of development projects received by the City Planning Division between January 1, 2008 and December 31, 2012. The publication also illustrates how Toronto has grown since the Official Plan came into force in June 2006 and how it will continue to develop over time.
“Toronto is the focal point for growth and development in the GTA. Our vibrancy and diversity attract investment, and we have been successful in directing this into intensification of the city using our Official Plan,” said Councillor Peter Milczyn (Ward 5 Etobicoke Lakeshore), Chair of the Planning and Growth Management Committee. “The city is home to almost 40 per cent of all residential units built from 2008 to 2012 in the GTA, and downtown accounts for about one quarter of all the office space currently under construction in Canada. This shows that Toronto has strong development prospects, bringing more people and jobs to the city.”
Between 2008 and 2012, the City of Toronto received proposals for over 148,000 residential units and 4.25 million square metres of non-residential space, about 40 per cent of which is in the downtown.
Toronto’s development industry is strong and continues to produce new projects. The majority of development proposed in the city is occurring in areas the Official Plan has targeted for growth. Since the Official Plan came into force, 82 per cent of the residential units proposed will be built in the downtown, in the four centres of Scarborough, Etobicoke, North York and Yonge-Eglinton, along the avenues and in other mixed-use areas of the city.
Approximately two-thirds of the non-residential space was also proposed in these same areas, with the remainder proposed in the employment districts or other employment areas, which the Official Plan also targets for growth.
The Official Plan’s employment districts will help the city reach its forecasted growth potential by the year 2041; the employment districts have 1.1 million square metres of the non-residential space proposed.
This latest edition of How Does the City Grow, along with previous issues, can be found on the City of Toronto’s website at http://www.toronto.ca/planning/grow.htm.
To sign up for City Planning email updates, please visit http://www.toronto.ca/e-updates.
Toronto is Canada’s largest city and sixth largest government, and home to a diverse population of about 2.8 million people. Toronto’s government is dedicated to delivering customer service excellence, creating a transparent and accountable government, reducing the size and cost of government and building a transportation city. For information on non-emergency City services and programs, Toronto residents, businesses and visitors can dial 311, 24 hours a day, 7 days a week.
————————————–
You may also want to know:
- Photography Copyright Kit (FREE)
- Sponsored Video: World-Changing Dreamers (IF WE Challenge) – Teaser (This is a social conversation contest. Enter the contest for a chance to win prize values up to $12,000, including a trip to Paris! The Contest is open from September 16 to October 28, 2013 inclusive. Please check the important contest rules.)
- KEVIN O’LEARY: 40 YEARS OF PHOTOGRAPHY Exhibit: To Benefit Teenage Entrepreneurs (Exhibit and sale of limited edition, signed, framed prints continues to November 15, 2013. O’Leary will donate all profits from the sale of his photographs to aspiring teenage entrepreneurs in an online “Future Dragon” contest launching later this year.)
- Energy Apps for Ontario Challenge: Win $50000 for Best Apps Using Electricity Data from Smart Meters (Oct. 1, 2013 to Jan. 7, 2014)
- “Still Waters Forget / Les eaux calmes oublient”: Photography Exhibition (October 9 – December 20, 2013)
- Life on the Grid Exhibit: 100 Years of Toronto Street Photography (Exhibit continues to May 2014 from Monday to Friday; Exhibit on Saturdays: from October 19, 2013 – April 12, 2014)
- Your Input: Use of Jets at Billy Bishop Toronto City Airport + Communities’ Cultural Infrastructure (14 Ward-Based Meetings from September 16 to October 30, 2013)
- Your Input: Toronto Neighbourhoods Oct.3-Nov.1 + Open Houses on Eglinton Ave.’s Future Oct.7-9, 2013
- You’re Invited: Great Canadian Events in Ontario Sept.7-Oct.31; Toronto Road Closures Sept 7-8, 2013
- You’re Invited: Toronto’s Great Events May 18 – 21 and Victoria Day May 20, 2013 (Heritage Toronto Tours April – October 2013)
